LinkedIn
WhatsApp
Mail
Lean Business Generation
Strategy Tools
Go-to-market Tools
Managing Results
Lean Business Services
Marketing Transformation
Lean Templates
Fundamentals
A3-Problem Solving
Hoshin Kanri Strategy Deployment
About Me
Blog
Lean Leadership
Lean Thinking
Lean Tools
Contact
Home
/ Products tagged “PDF”
PDF
Template Categories:
A3-Problem Solving
6
6 products
Fundamentals
5
5 products
Hoshin Kanri Strategy Deployment
3
3 products
A3/Problem Solving Bundle
€
129,95
Add to cart
A3/Problem Solving Template
€
9,95
Add to cart
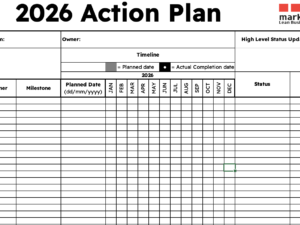
Action Plan Template Monthly (2026)
€
0,00
–
€
29,95
Price range: € 0,00 through € 29,95
Select options
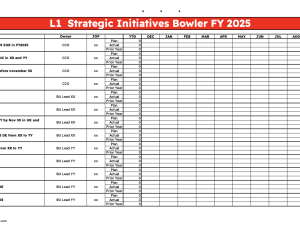
Bowler KPI Report
€
0,00
–
€
29,95
Price range: € 0,00 through € 29,95
Select options
Hoshin Kanri BUNDLE: X-Matrix & TTI Bowler
€
99,95
Add to cart
Hoshin Kanri TTI Bowler – Strategic Planning Template (PDF)
€
0,00
Add to cart
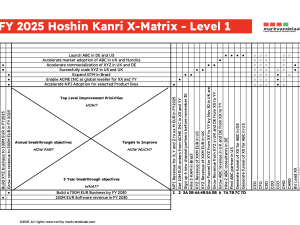
Hoshin Kanri X-Matrix – Strategic Planning Template (PDF)
€
0,00
Add to cart
Ishikawa Diagram 5M
€
0,00
Add to cart
Ishikawa Diagram 8P
€
0,00
Add to cart
Pareto Chart Template
€
0,00
–
€
7,95
Price range: € 0,00 through € 7,95
Select options
Problem Solving Tree
€
0,00
Add to cart
Run Chart Template
€
0,00
–
€
7,95
Price range: € 0,00 through € 7,95
Select options
SIPOC Template
€
0,00
–
€
12,95
Price range: € 0,00 through € 12,95
Select options
Notifications